The Wall Street Journal recently reported Americans Are No Longer Gluttons for Electricity. Really?
The article pointed out how data show average residential electricity consumption has been on a downward trend since 2010. It also went on to point out the only reasonable explanation for the decline is the widespread adoption of LED lightbulbs thanks to how incredibly efficient they are compared to traditional bulbs. This is worth digging into a bit more deeply to see what’s really going on here.
What We Know About Electricity Consumption
One thing that has become clear is how electricity consumption has traditionally tended to move in lockstep with general economic conditions. In other words, during an economic downturn, you expect people to cut back on electricity consumption in order to save a few precious dollars.
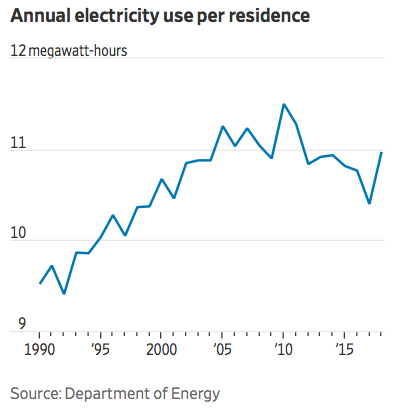
The Great Recession hit in 2008, so you’d expect to see a decline, which there was. In 2007, the average household electricity consumption was 11.232 megawatt-hours. In 2008 this figure declined to 10.9 megawatt-hours. You can see a graph of these numbers below:

But what in the world happened in 2010? There was a big spike in average residential electricity use, to 11.5 megawatt-hours. As it turns out, 2010 saw an especially hot summer, which means there was a whole lot of air conditioning going on.
And then the economic recovery got underway. Normally, we would expect electricity usage to start going back up as the economy got back to growth mode. But electricity use dropped in 2011 and again in 2012. Then it ticked back up just a tiny bit in both 2013 and 2014, then dropped significantly again n 2015, 2016, and 2017.
You can see it has ticked back up in 2018 but is still below pre-recession usage. With the longest economic recovery in history still humming along, what can possibly explain this downward trend in average residential electricity consumption? The LED bulb adoption idea just doesn’t seem like it would be enough to explain it. A number of alternative explanations were considered and rejected by Berkeley economist Lucas Davis in in may 2017 paper, Evidence of a Decline in Electricity Use by US Households.
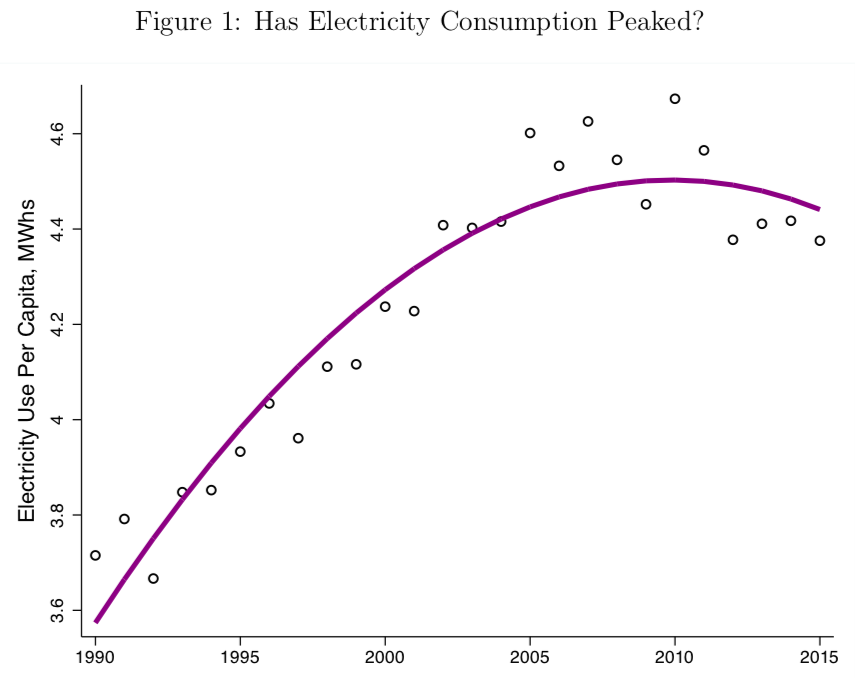
Before getting into possible alternative explanations, it’s especially useful to see how Davis depicts the downward trend in residential electricity consumption. When you look at the graph presented in the Wall Street Journal article, the downward trend isn’t visibly obvious. If anything, it looks all over the place. But look how Davis showed it in his paper:

The technical term for the technique used to draw that line through the various plot points (which are essentially the same as the WSJ graph from above) is a “fitted cubic polynomial.” What it shows is the big-picture curve of this trend, and you can see why people are wondering if residential electricity consumption has peaked.
Of course, his graph only goes through 2015. It would be interesting to see what it would look like with several more recent years of data worked into it. It’s safe to assume, though, that it would continue to show the downward trend. Here are some of the alternative reasons Davis considered:
- Household Income: Per capita GDP and median household income have both been going up during the economic recovery, which would normally cause electricity use to increase, and yet it has gone down.
- Price of Electricity: If the cost of electricity went up a lot, that could cause a decrease. But when adjusted for inflation, there was no real increase in the average price of electricity at all from 2010 to 2015. It should also be noted that in the past, increases in prices don’t result in drastic reductions in electricity use, and certainly not the kind of decline happening now.
- Weather: The spike in 2010 was because it was an especially hot summer. But the weather since then hasn’t been so extreme in the other direction to justify the declines.
- Solar Installations: A lot more homes have solar panels than before, but these are concentrated in only a handful of states, (especially California and Hawaii) and the declines have been significant in virtually all states.
Realizing there simply weren’t any reasonable alternative explanations is why Davis settled on the widespread adoption of LED and another energy-efficient lighting. If there have been a billion installations of LED, CFL, and another more efficient lighting in place of traditional incandescent bulbs in homes and apartments, it actually could account for the decline.
What’s interesting is that lighting accounts for a fairly small portion of residential electricity consumption – only about 15% in most homes back in 2010. But then that lighting share of electricity use dropped from 2010 to 2015 by more than a third! And it has continued falling since then. In 2018, only 6% of residential electricity went to lighting.
Thus, even though it’s such a small piece of the residential electricity puzzle, it’s enough to explain the recent declines. As more efficient lighting continues to be adopted, it will be interesting to see if this downward trend continues.
As encouraging as the apparent downward trend may be – and we need to keep an eye on it to see where it goes from here – it’s also important to put it in perspective. Overall, total electricity used in the US, including the other sectors (commercial, industrial, transportation), continues to rise. In fact, the US produced more electricity in 2018 than at any other time in history.
If you’re ready to play your part in using less electricity and other forms of energy in your home or apartment, the easiest way to get started is by taking advantage of the NEEECO no-cost Mass Save® Energy Assessment. We’ll show you all sorts of ways to make your home more energy-efficient, and we’ll even do a few things completely free of charge, including the installation of ENERGY STAR® LED light bulbs so you can contribute to the downward trend in residential electricity consumption!
Call (781) 514-5882 or contact us to get started with a no-cost Mass Save® home energy assessment.
